Foresight AI is building a data platform for autonomous mobile robots. Since the founding of the company, we have focused not only on generating high-quality, accurate, and useful data for our customers, but also on making our data beautiful, easy-to-use, and accessible to all. For example, we have applied cutting-edge technologies and software frameworks, such as deck.gl, Three.js , Potree to enable high-fidelity and smooth visualizations. And, we also launched our Data Portal to provide quick access via any web browser to our corpus of 3D maps and dynamic driving data.
Foresight AI’s goal is to build the world’s largest driving scenario database for training and validating automated driving systems.
In this blog post, we share our journey in building our own 3D visualization tool and then turning to the Uber AVS framework for support as we required additional features and scale. We outline what our original data visualization tool goals were, how our key feature needs evolved over time, and what our experience using AVS has been like in the hope others will benefit from learning about our path to using AVS.
Foresight AI’s goal is to build the world’s largest driving scenario database for training and validating automated driving systems. These driving scenarios consist of high-definition, 3D point clouds, maps, and 3D object trajectories that reflect the natural movements and interactivity among various object types around the world.
Our goals for our first driving scenario visualization tool were simple:
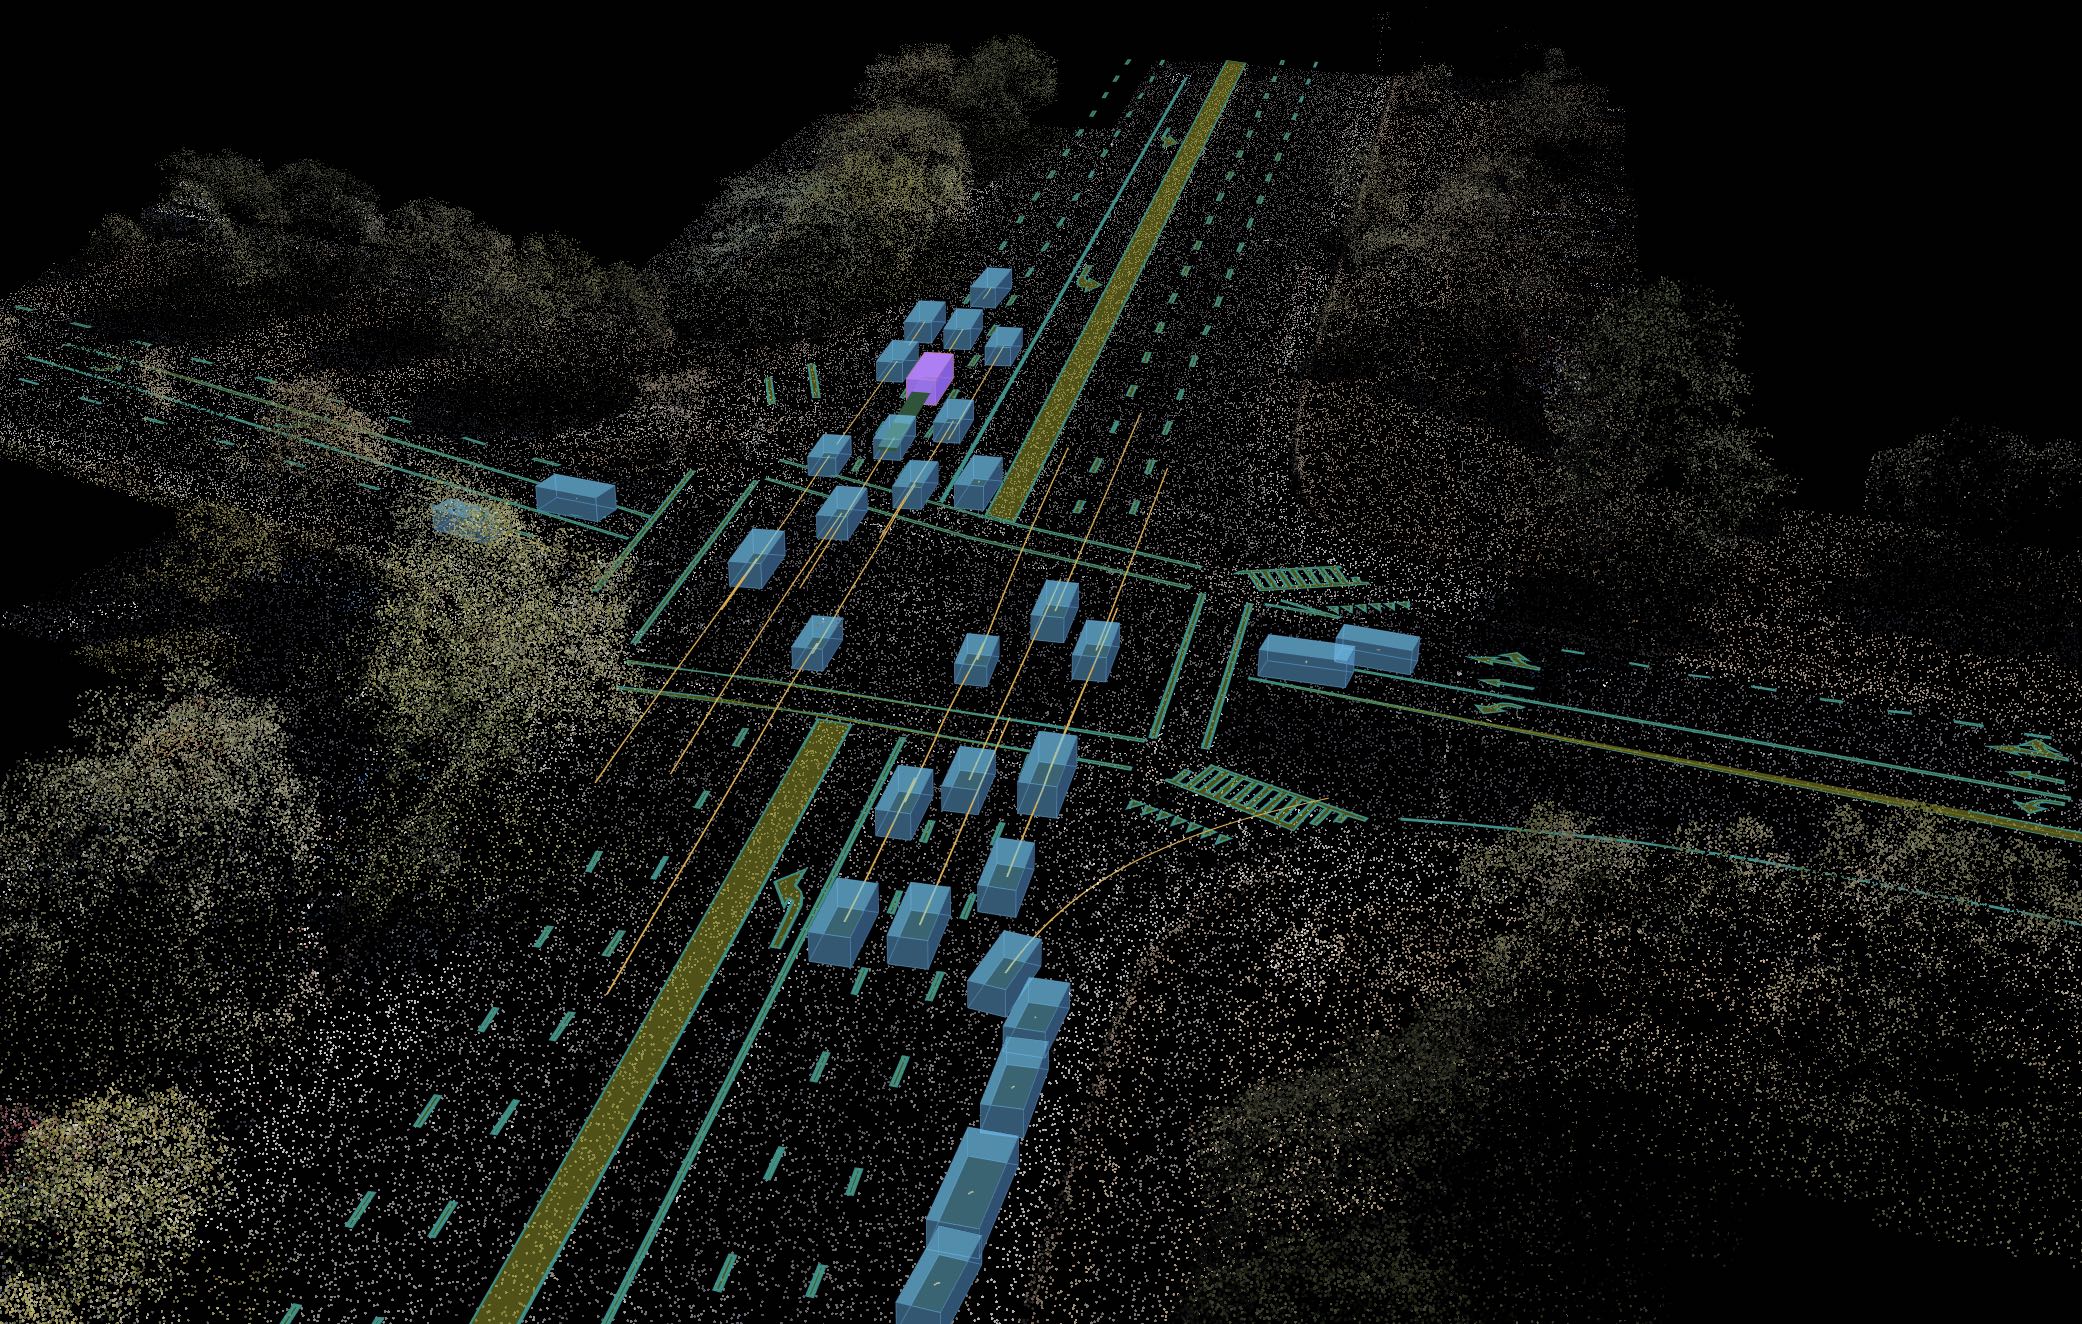
- Show all of the moving vehicles together with the 3D point cloud and an HD map in the world coordinate system.
- Allow users to navigate around the 3D world and to interact with any of the vehicles to understand their behavior (e.g., x/y/z position, velocity, acceleration, etc.).
- Make the data accessible from anywhere with the least amount of effort required.
We started to research different data visualization frameworks available on the market. We knew we did not need to utilize the full feature set of higher-end simulators. While doing our homework, we learned about Uber’s web platform to visualize the world around an ego vehicle, as outlined here: https://eng.uber.com/atg-dataviz/. The team thought this was a beautiful demonstration (and hoped Uber would share this as an open source project, similar to its others listed here: https://uber.github.io/).
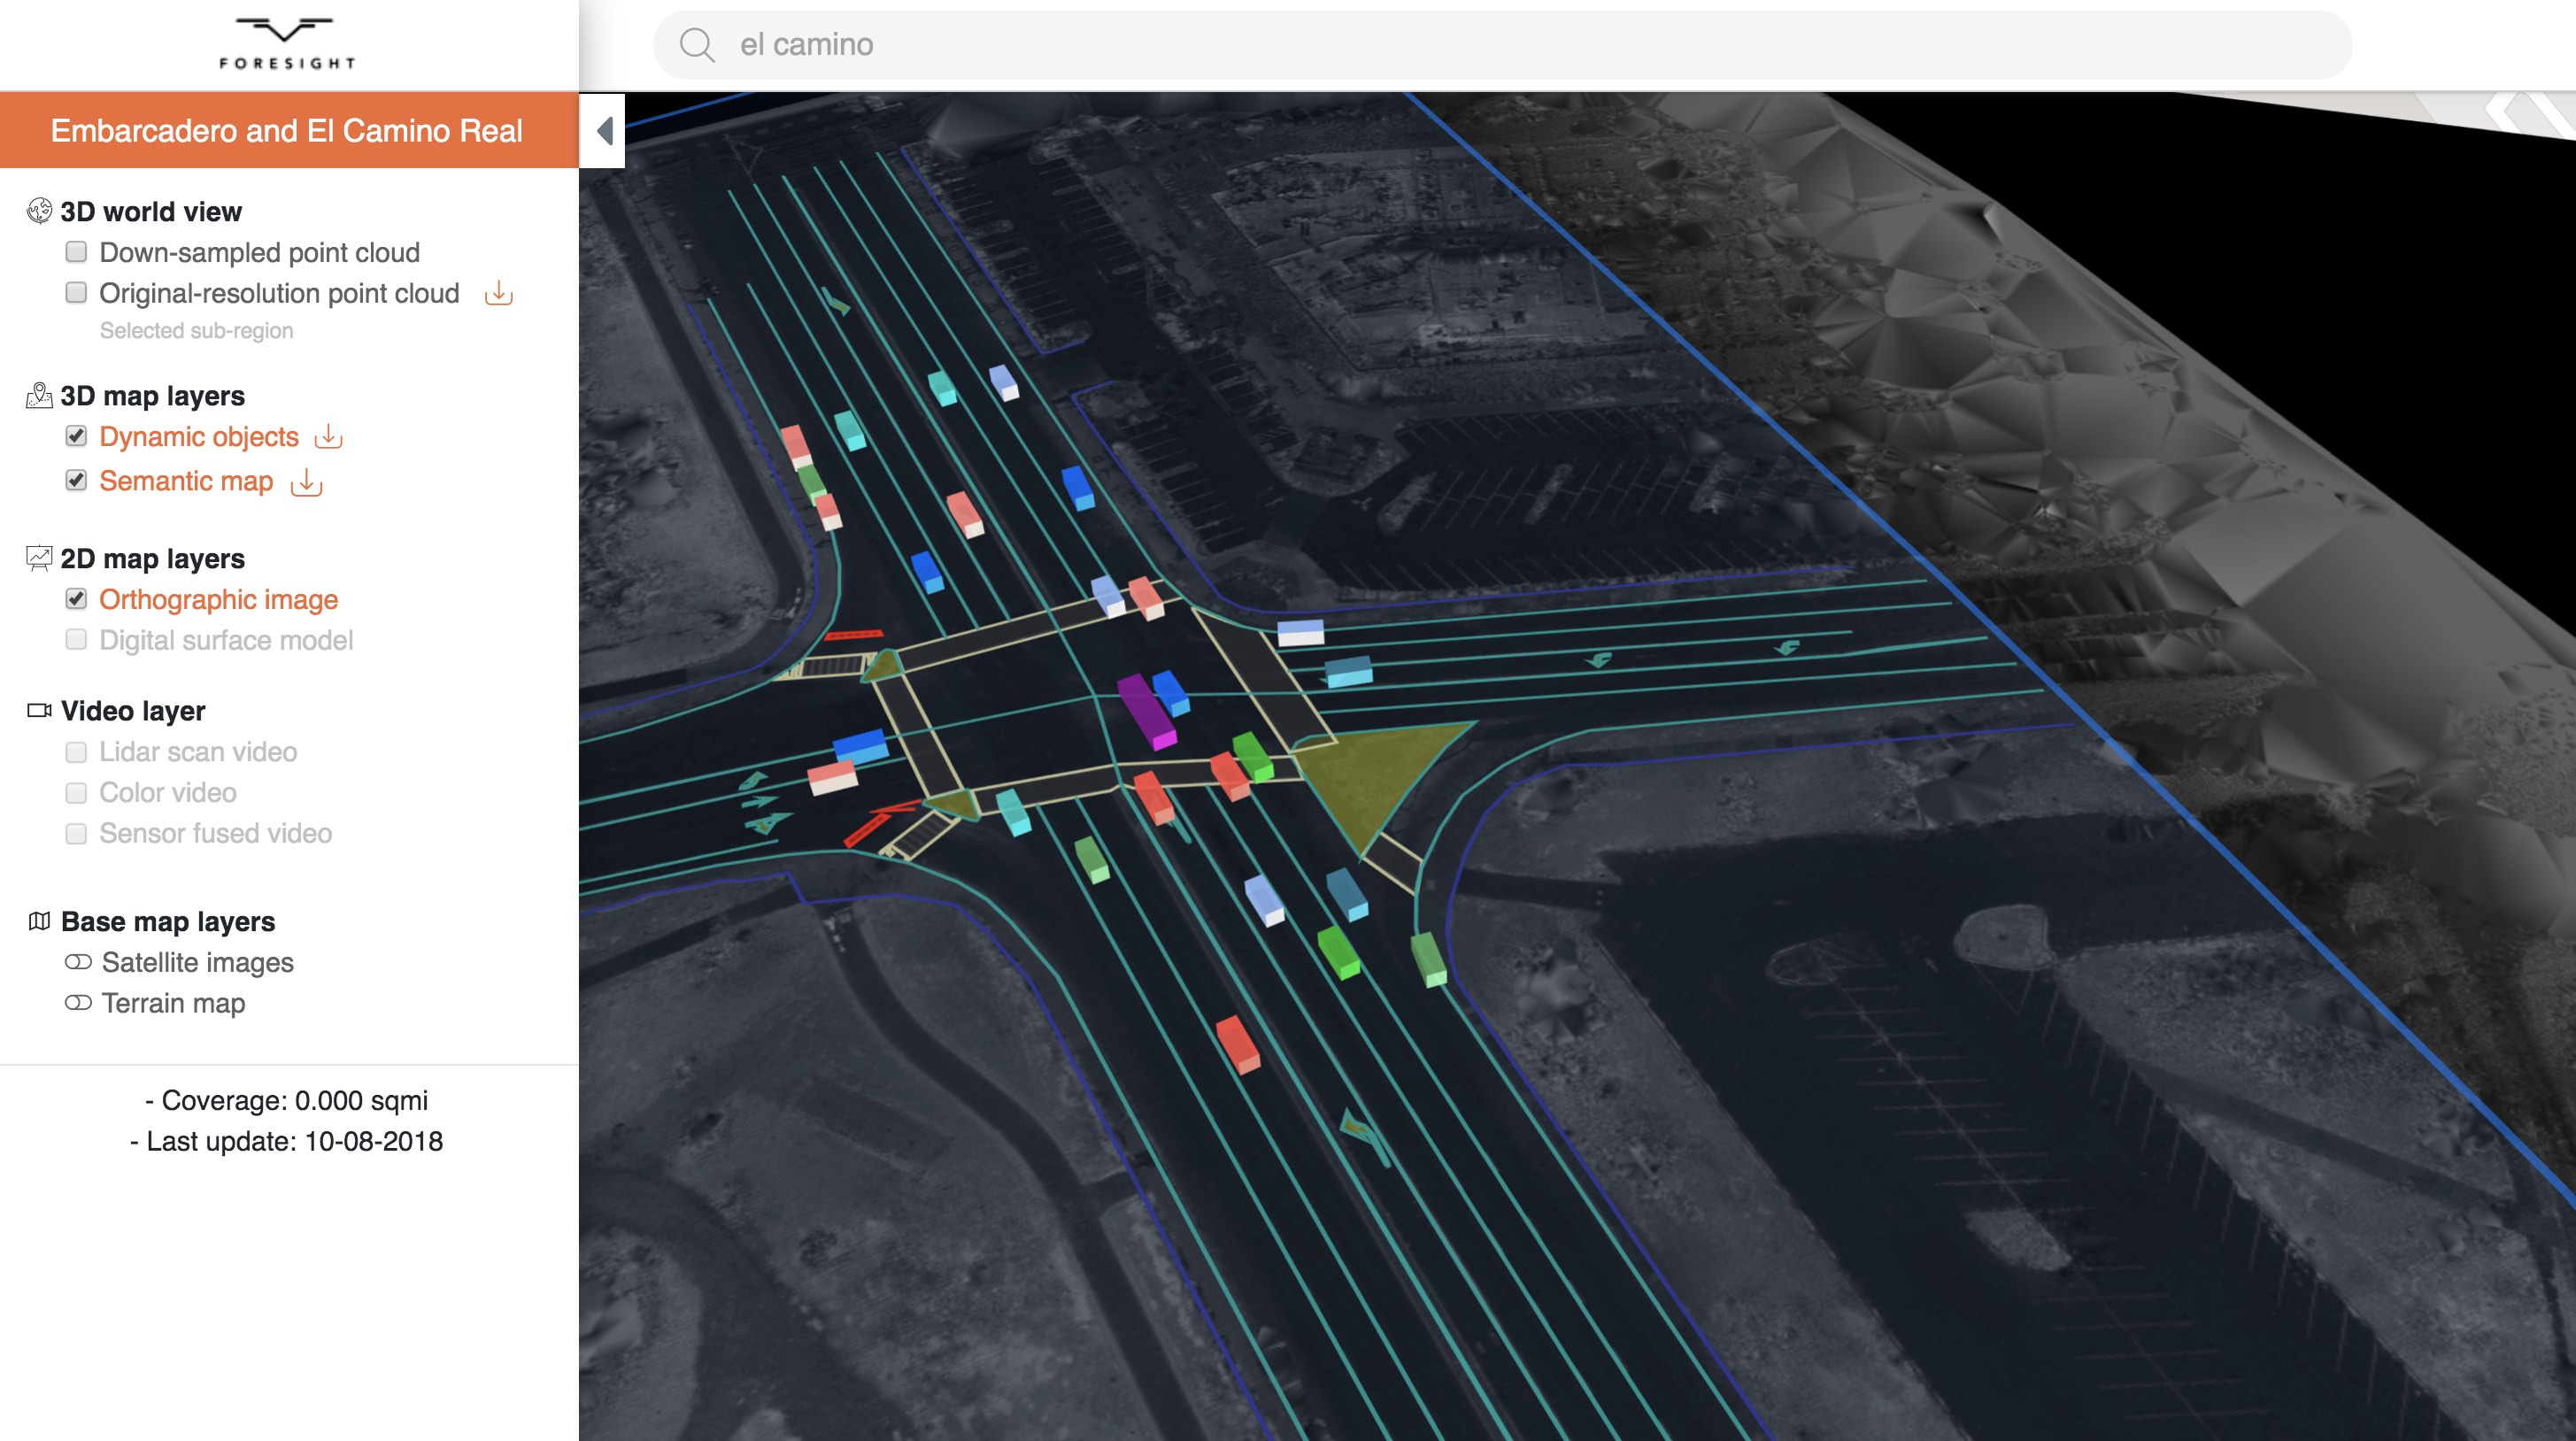
Indeed, we were no strangers to Uber open source frameworks. We had used the powerful deck.gl framework to build our web-based data portal (see Figure 2) that enables users to interact with all of the layers of our data, including high quality 3D point clouds, orthographic images, digital surface model images, semantic maps, and dynamic driving behavior scenarios. Deck.gl is fantastic, and it fully-supported what we wanted to build and offer to our customers and the larger AV community.
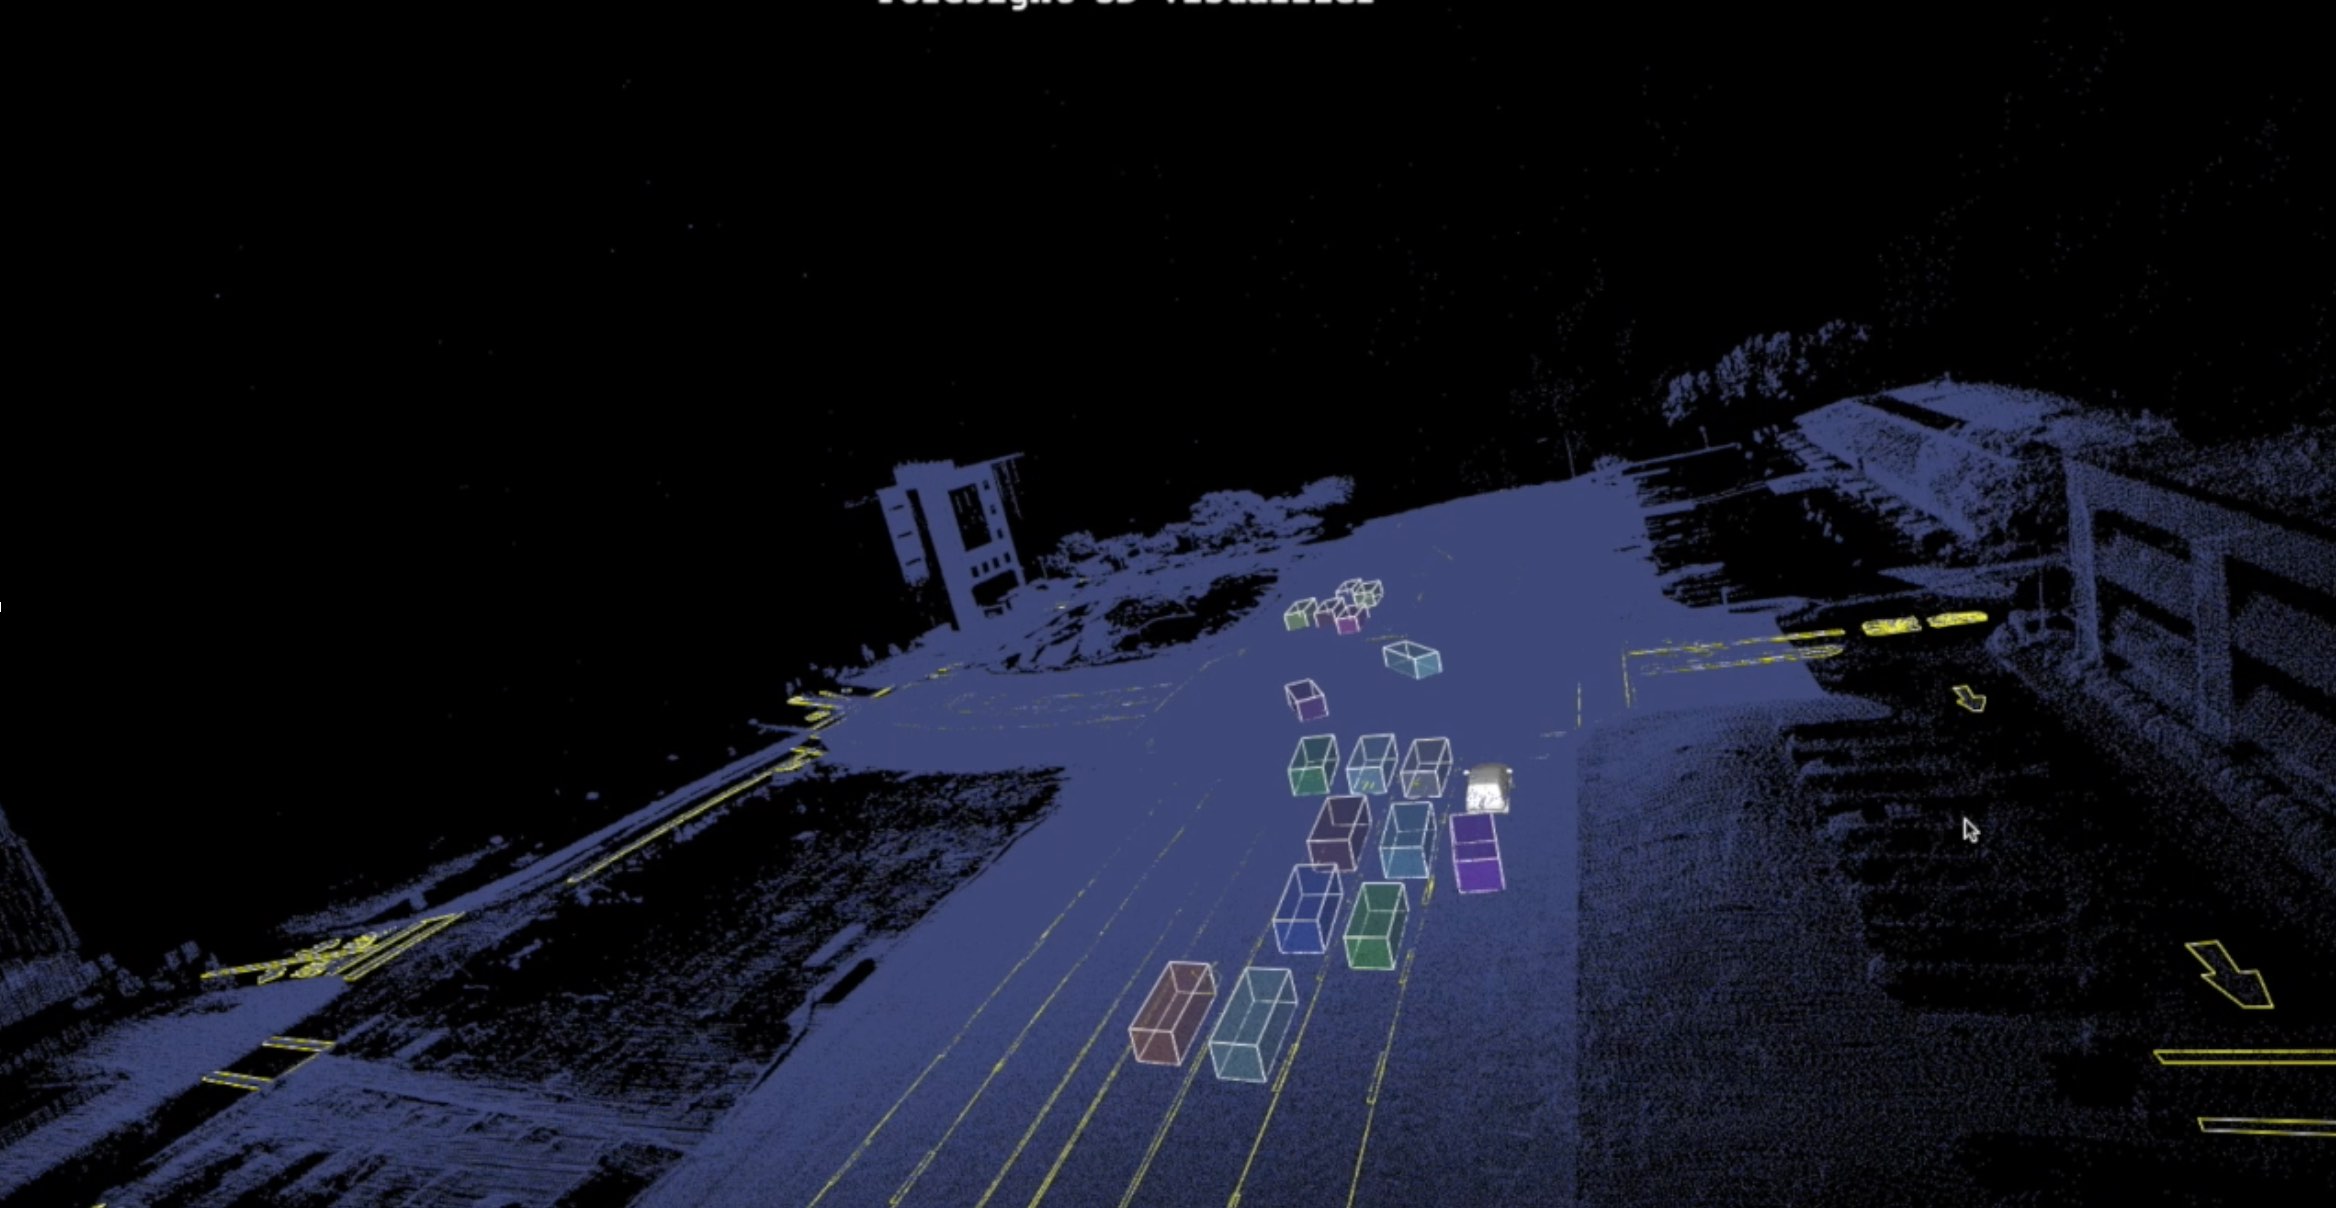
Around the same time, we learned that Uber was going to release the Autonomous Visualization System (AVS). The only problem was that we could not wait! So, we built our own data visualizer using three.js . Our new tool worked pretty well for us. It enabled us to expose all of the various data layers, as seen below in Figure 3.
As our data rapidly grew, however, we needed more than just a data visualizer. We also needed a portal to manage all of the datasets and to support a querying system to enable search and filtering for specific datasets of interest to each user. So, once again we started to survey the market for a solution that could now meet our updated list of required features.
Fortunately, Uber released AVS around this time. AVS consisted of XVIZ for data structure and streetscape.gl for presentation. It was a timely release! Its beautiful design handled by modularized react components, well-structured code base, and great support documentation made AVS our tool of choice.
Still, the Foresight AI engineering team faced two notable challenges to consider. First, AVS’ data stream is ego-car centric, and XVIZ doesn't yet have an API to expose underlying information such as velocity, acceleration, or heading angle for auxiliary cars in the same scenario. But, in Foresight’s multi-layer, multi-object data model, we wanted our customers to be able to pick any vehicle in the scene as the designated ego-car. And second, in AVS’s design, XVIZ embeds the semantic map and 3D point cloud data in each frame. But this approach led to a significant performance drain for the tool because Foresight often finds the most interesting driving behavior scenarios are captured at large, busy intersections that can include hundreds of dynamic movements that are all extracted and included in our scenarios. So, the Foresight team needed a static layer for the semantic map and 3D point cloud in order to better support our desired performance level under such a heavy data load.
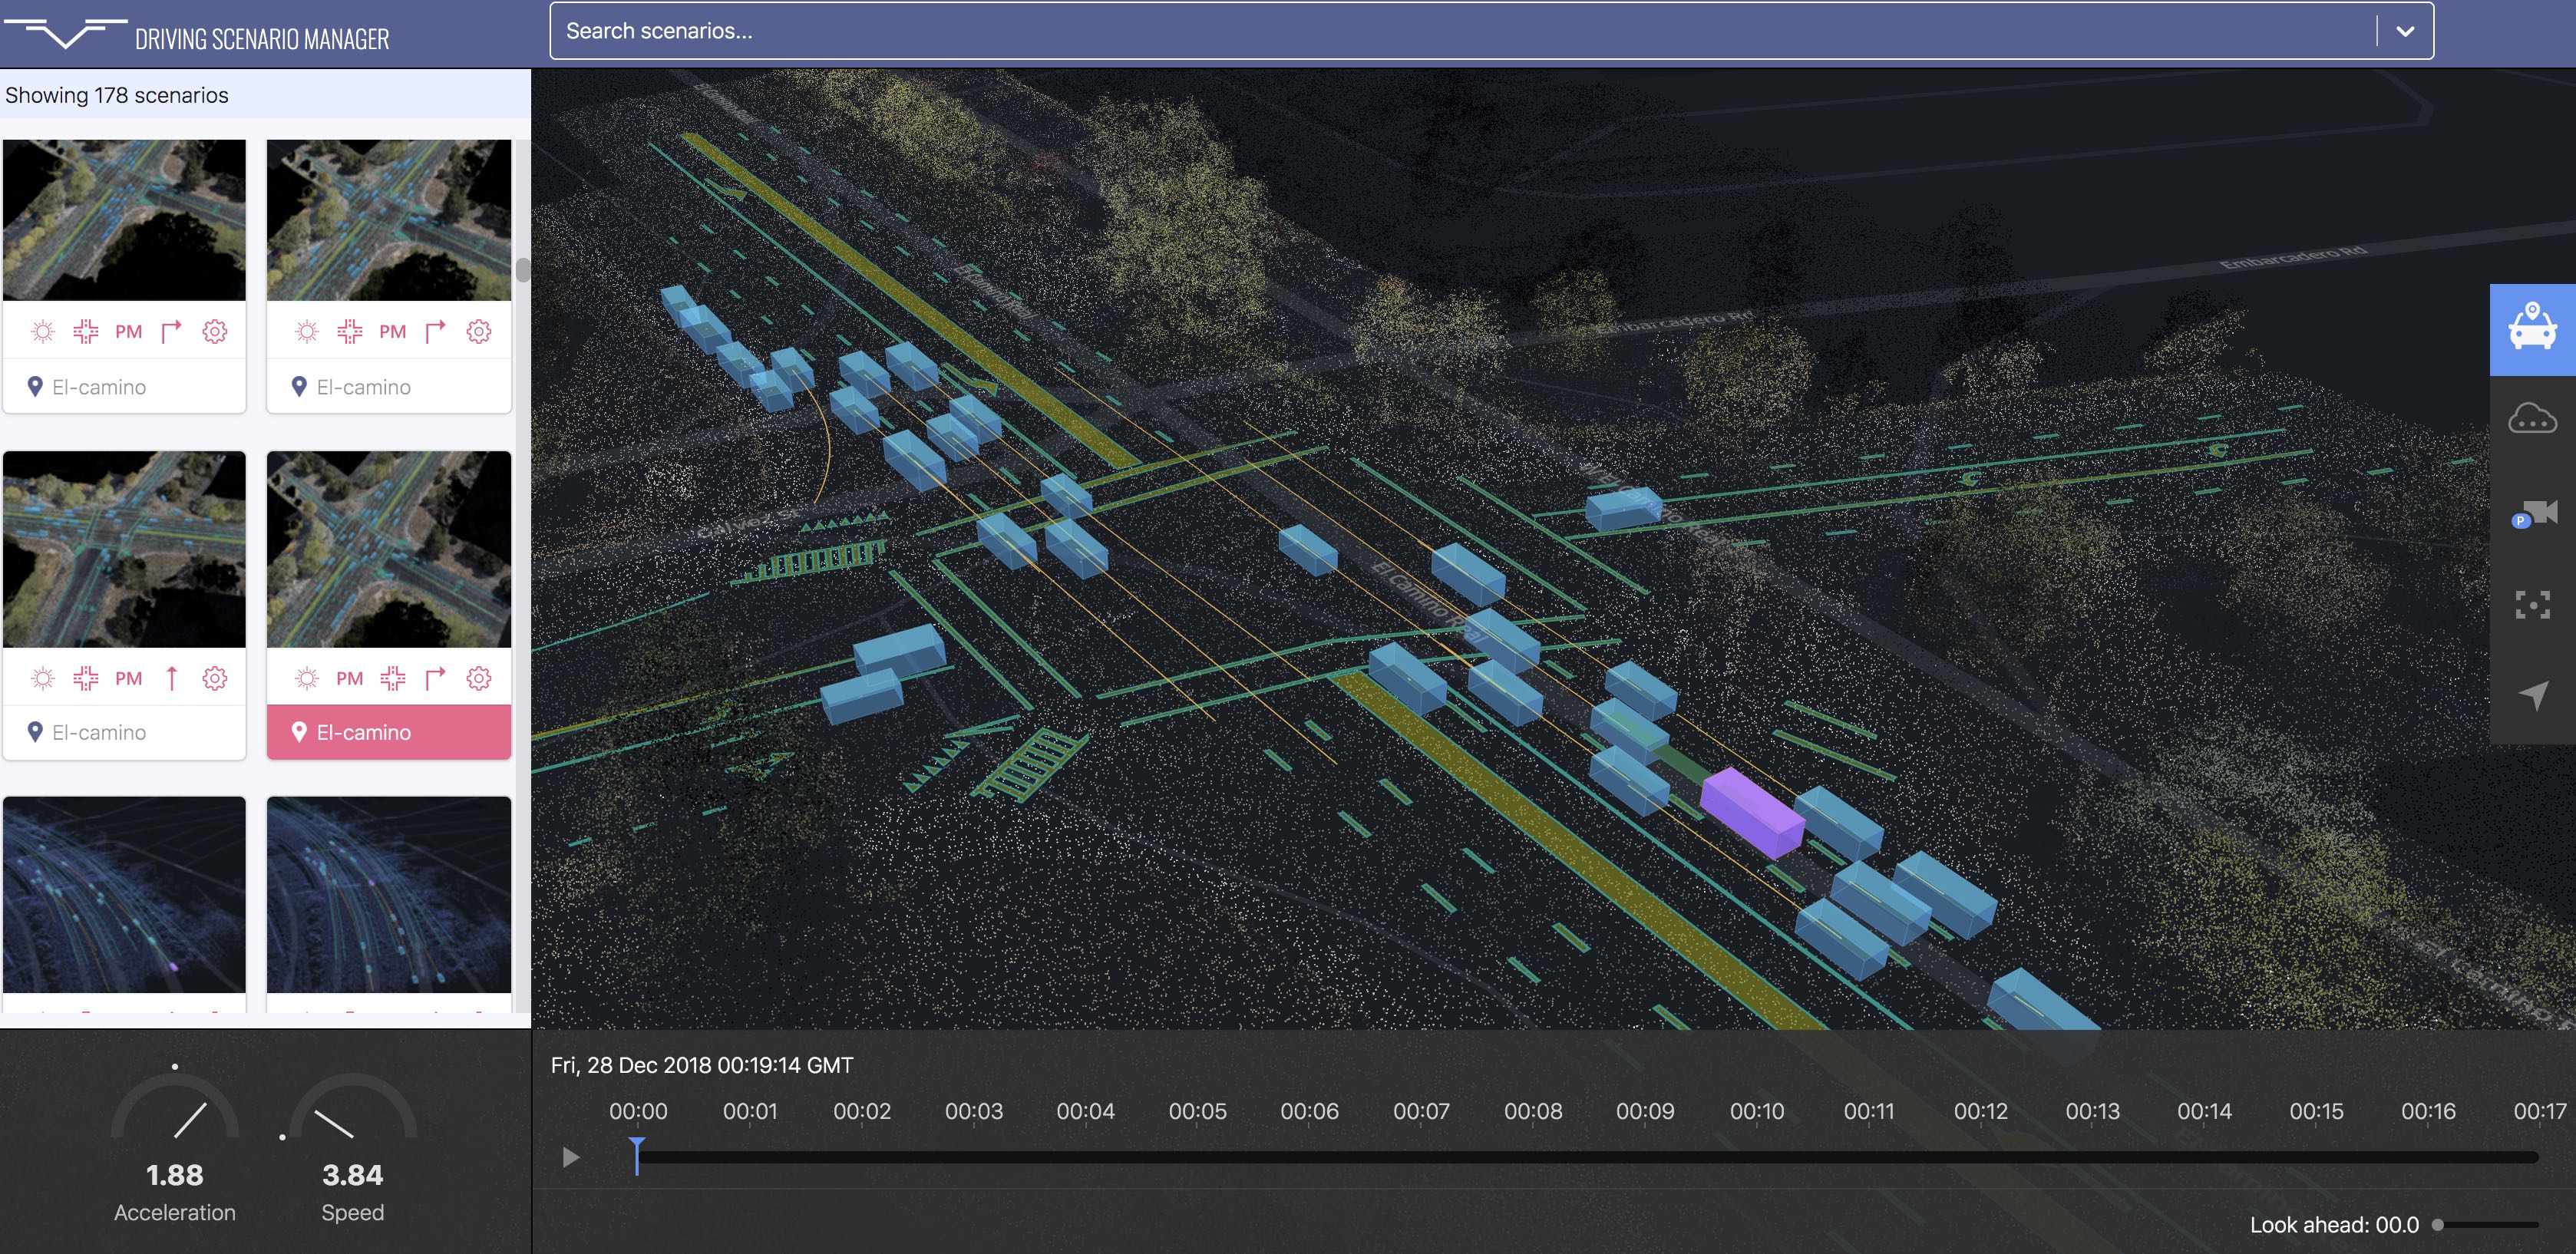
But thankfully, because of the well-documented and modularized framework of AVS, Foresight was able to extend XVIZ’s data structure to hold the additional information we needed while also modifying streetscapes.gl to perform camera parameter calculations to achieve our goals. The XVIZ validation API was extremely useful for us to detect potential data conversion issues early in order to correct them. And, since our team was already familiar with deck.gl, we were able to modify streetscapes.gl to render the static layers for the semantic maps and the 3D point clouds, and thus, made the visualizer run smoothly. Finally, the engineers wrapped everything into a clean-looking portal with a querying system, the Driving Scenario Manager , in order to manage our growing corpus of driving scenarios (shown in Figure 4 below).
In summary, we are grateful to Uber for open-sourcing streetscapes.gl, XVIZ, vis.gl, and deck.gl to the larger community. Foresight has moved more quickly, met our feature needs and customer demands better, and pushed the envelope further on showcasing the full value of our data through the use of Uber’s open frameworks and tools. We look forward to further collaborations and continuing to push the limits of how our data is visualized, shared, and used to help AV companies bring their important products to market faster, more broadly, and more safely for everyone.
Thank you Uber from the entire Foresight AI team and from all of our customers and partners too!